分布式跟踪系统

概述

Zipkin是一款开源的分布式实时数据追踪系统(Distributed Tracking System),基于 Google Dapper的论文设计而来,由 Twitter 公司开发贡献。其主要功能是聚集来自各个异构系统的实时监控数据。
各业务系统在彼此调用时,将特定的跟踪消息传递至zipkin,zipkin在收集到跟踪信息后将其聚合处理、存储、展示等,用户可通过web UI方便获得网络延迟、调用链路、系统依赖等等。

Zipkin主要包括四个模块:

  • Collector 接收或收集各应用传输的数据
  • Storage 存储接受或收集过来的数据,当前支持Memory,MySQL,Cassandra,ElasticSearch等,默认存储在内存中。
  • API(Query) 负责查询Storage中存储的数据,提供简单的JSON API获取数据,主要提供给web UI使用
  • Web 提供简单的web界面

zipkin

Zipkin的几个基本概念:

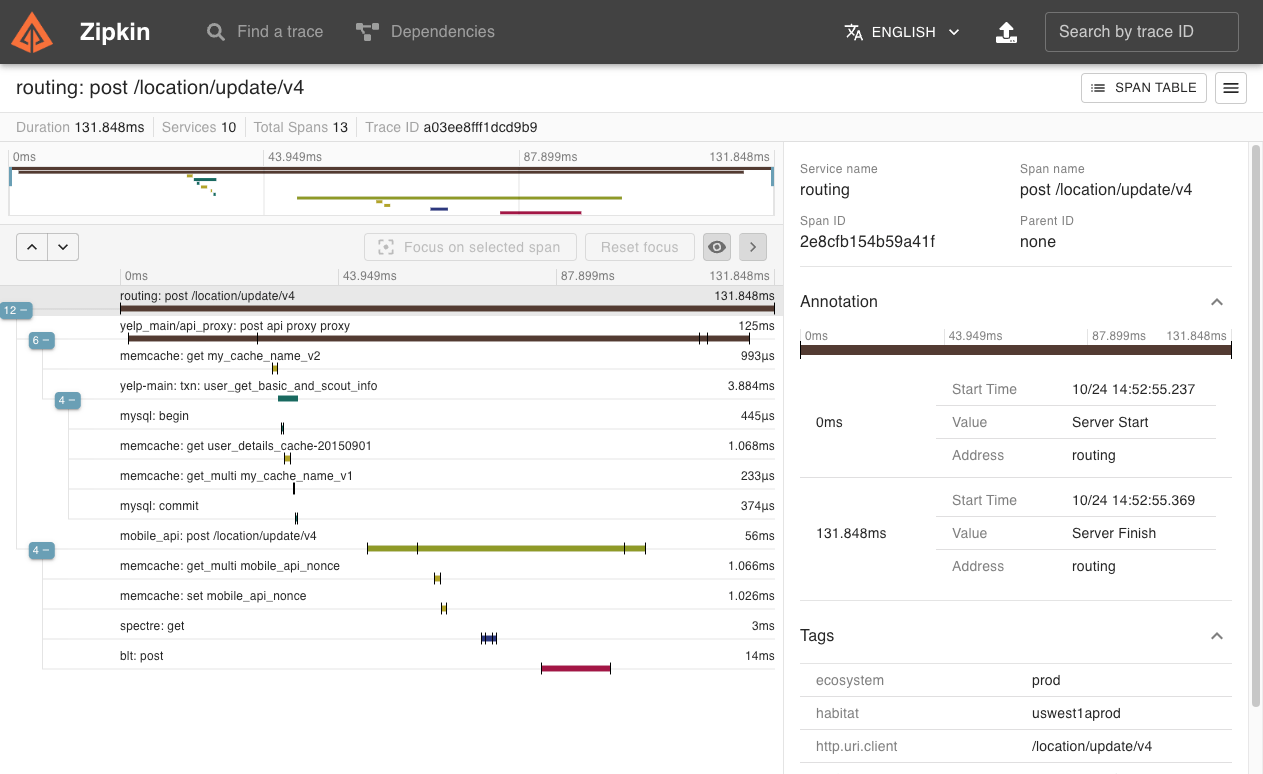
  • Span:基本工作单元,一次链路调用(可以是RPC,DB等没有特定的限制)创建一个span,通过一个64位ID标识它, span通过还有其他的数据,例如描述信息,时间戳,key-value对的(Annotation)tag信息,parent-id等,其中parent-id 可以表示span调用链路来源,通俗的理解span就是一次请求信息
  • Trace:类似于树结构的Span集合,表示一条调用链路,存在唯一标识,即TraceId
  • Annotation:注解,用来记录请求特定事件相关信息(例如时间),通常包含四个注解信息
    • cs - Client Start,表示客户端发起请求
    • sr - Server Receive,表示服务端收到请求
    • ss - Server Send,表示服务端完成处理,并将结果发送给客户端
    • cr - Client Received,表示客户端获取到服务端返回信息
  • BinaryAnnotation:提供一些额外信息,一般以key-value对出现

Tracers live in your applications and record timing and metadata about operations that took place. They often instrument libraries, so that their use is transparent to users. For example, an instrumented web server records when it received a request and when it sent a response. The trace data collected is called a Span.

Instrumentation is written to be safe in production and have little overhead. For this reason, they only propagate IDs in-band, to tell the receiver there’s a trace in progress. Completed spans are reported to Zipkin out-of-band, similar to how applications report metrics asynchronously.

For example, when an operation is being traced and it needs to make an outgoing http request, a few headers are added to propagate IDs. Headers are not used to send details such as the operation name.

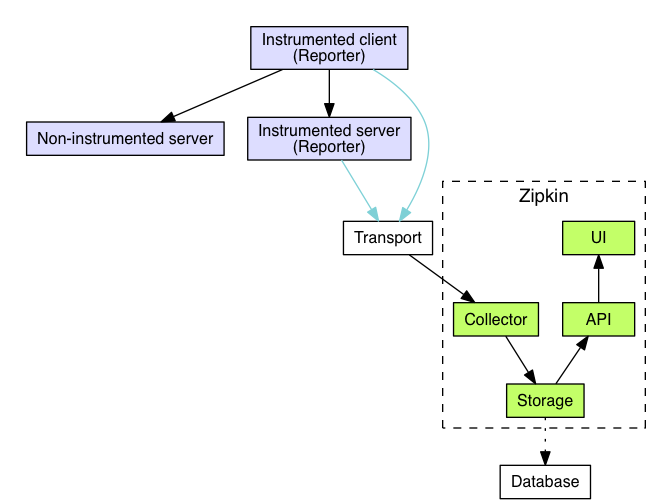
The component in an instrumented app that sends data to Zipkin is called a Reporter. Reporters send trace data via one of several transports to Zipkin collectors, which persist trace data to storage. Later, storage is queried by the API to provide data to the UI.

流程图

Here’s a diagram describing this flow:


As mentioned in the overview, identifiers are sent in-band and details are sent out-of-band to Zipkin. In both cases, trace instrumentation is responsible for creating valid traces and rendering them properly. For example, a tracer ensures parity between the data it sends in-band (downstream) and out-of-band (async to Zipkin).

Here’s an example sequence of http tracing where user code calls the resource /foo. This results in a single span, sent asynchronously to Zipkin after user code receives the http response.

1
2
3
4
5
6
7
8
9
10
11
12
13
14
15
16
17
18
19
20
21
22
23
24
25
26
27
28
29
30
31
32
33
34
35
36
37
38
39
40
┌─────────────┐ ┌───────────────────────┐ ┌─────────────┐ ┌──────────────────┐
│ User Code │ │ Trace Instrumentation │ │ Http Client │ │ Zipkin Collector │
└─────────────┘ └───────────────────────┘ └─────────────┘ └──────────────────┘
│ │ │ │
┌─────────┐
│ ──┤GET /foo ├─▶ │ ────┐ │ │
└─────────┘ │ record tags
│ │ ◀───┘ │ │
────┐
│ │ │ add trace headers │ │
◀───┘
│ │ ────┐ │ │
│ record timestamp
│ │ ◀───┘ │ │
┌─────────────────┐
│ │ ──┤GET /foo ├─▶ │ │
│X-B3-TraceId: aa │ ────┐
│ │ │X-B3-SpanId: 6b │ │ │ │
└─────────────────┘ │ invoke
│ │ │ │ request │
│ │ │ │ │
┌────────┐ ◀───┘
│ │ ◀─────┤200 OK ├─────── │ │
────┐ └────────┘
│ │ │ record duration │ │
┌────────┐ ◀───┘
│ ◀──┤200 OK ├── │ │ │
└────────┘ ┌────────────────────────────────┐
│ │ ──┤ asynchronously report span ├────▶ │
│ │
│{ │
│ "traceId": "aa", │
│ "id": "6b", │
│ "name": "get", │
│ "timestamp": 1483945573944000,│
│ "duration": 386000, │
│ "annotations": [ │
│--snip-- │
└────────────────────────────────┘

由上图可以看出,应用的代码(User Code)发起Http Get请求(请求路径/foo),经过Trace框架(Trace Instrumentation)拦截,并依次经过如下步骤,记录Trace信息到Zipkin中:

  • 1.记录tags信息
  • 2.将当前调用链的Trace信息记录到Http Headers中
  • 3.记录当前调用的时间戳(timestamp)
  • 4.发送http请求,并携带Trace相关的Header,如X-B3-TraceId:aa,X-B3-SpandId:6b
  • 5.调用结束后,记录当次调用所花的时间(duration)

将步骤1-5,汇总成一个Span(最小的Trace单元),异步上报该Span信息给Zipkin Collector

Trace instrumentation report spans asynchronously to prevent delays or failures relating to the tracing system from delaying or breaking user code.

Transport

Spans sent by the instrumented library must be transported from the services being traced to Zipkin collectors. There are three primary transports: HTTP, Kafka and Scribe. See Span Receivers for more information.

ZipkinServer

ZipkinServer本身是一个SpringBoot应用程序,可以作为一个jar启动。类ZipkinServer上使用了@EnableZipkinServer注解,加载了相关的Bean,而且在启动方法中添加了监听器RegisterZipkinHealthIndicators类,来初始化健康检查的相关bean。
Span的存储和收集可以根据实际情况进行配置,默认情况下,存储使用了内存方式,收集则是使用了http post (/api/v1/spans)方式。监听端口默认为9411.

1
2
3
4
5
6
7
8
9
10
11
12
13
14
15
package zipkin.server;
import org.springframework.boot.autoconfigure.SpringBootApplication;
import org.springframework.boot.builder.SpringApplicationBuilder;
@SpringBootApplication
@EnableZipkinServer
public class ZipkinServer {
public static void main(String[] args) {
new SpringApplicationBuilder(ZipkinServer.class)
.listeners(new RegisterZipkinHealthIndicators())
.properties("spring.config.name=zipkin-server").run(args);
}
}

运行mvn package之后可以得到zipkin-server-{version}-exec.jar,运行java -jar zipkin-server-{version}-exec.jar。
运行结果如下:

1
2
3
4
5
6
7
8
9
10
11
12
13
14
15
16
17
18
19
20
21
22
23
24
25
26
27
28
29
30
31
32
xis-macbook-pro:node_modules xiningwang$ java -jar /Users/xiningwang/localgit/zipkin/zipkin-server/target/zipkin-server-2.4.3-SNAPSHOT-exec.jar
********
** **
* *
** **
** **
** **
** **
********
****
****
**** ****
****** **** ***
****************************************************************************
******* **** ***
**** ****
**
**
***** ** ***** ** ** ** ** **
** ** ** * *** ** **** **
** ** ***** **** ** ** ***
****** ** ** ** ** ** ** **
:: Powered by Spring Boot :: (v1.5.8.RELEASE)
.......
2017-12-25 14:39:26.410 INFO 94492 --- [ main] o.s.b.a.e.mvc.EndpointHandlerMapping : Mapped "{[/auditevents || /auditevents.json],methods=[GET],produces=[application/vnd.spring-boot.actuator.v1+json || application/json]}" onto public org.springframework.http.ResponseEntity<?> org.springframework.boot.actuate.endpoint.mvc.AuditEventsMvcEndpoint.findByPrincipalAndAfterAndType(java.lang.String,java.util.Date,java.lang.String)
2017-12-25 14:39:27.061 INFO 94492 --- [ main] o.s.j.e.a.AnnotationMBeanExporter : Registering beans for JMX exposure on startup
2017-12-25 14:39:27.071 INFO 94492 --- [ main] o.s.c.support.DefaultLifecycleProcessor : Starting beans in phase 0
2017-12-25 14:39:27.243 INFO 94492 --- [ main] b.c.e.u.UndertowEmbeddedServletContainer : Undertow started on port(s) 9411 (http)
2017-12-25 14:39:27.252 INFO 94492 --- [ main] zipkin.server.ZipkinServer : Started ZipkinServer in 9.434 seconds (JVM running for 10.054)

数据存储

以mysql为例。
启动mysql及zipkin:

1
2
3
docker run --name mysql57 -e MYSQL_ROOT_PASSWORD=passw0rd -d mysql:5.7.20
STORAGE_TYPE=mysql MYSQL_USER=root MYSQL_PASS=passw0rd java -jar /Users/xiningwang/localgit/zipkin/zipkin-server/target/zipkin-server-2.4.3-SNAPSHOT-exec.jar

默认情况下,以下属性使用如下默认值:

1
2
3
4
5
6
* `MYSQL_DB`: The database to use. Defaults to "zipkin".
* `MYSQL_USER` and `MYSQL_PASS`: MySQL authentication, which defaults to empty string.
* `MYSQL_HOST`: Defaults to localhost
* `MYSQL_TCP_PORT`: Defaults to 3306
* `MYSQL_MAX_CONNECTIONS`: Maximum concurrent connections, defaults to 10
* `MYSQL_USE_SSL`: Requires `javax.net.ssl.trustStore` and `javax.net.ssl.trustStorePassword`, defaults to false.

例子

1
2
3
4
5
6
7
8
9
10
11
<dependency>
<groupId>org.springframework.cloud</groupId>
<artifactId>spring-cloud-starter-sleuth</artifactId>
<version>1.1.2.RELEASE</version>
</dependency>
<!-- https://mvnrepository.com/artifact/org.springframework.cloud/spring-cloud-sleuth-zipkin -->
<dependency>
<groupId>org.springframework.cloud</groupId>
<artifactId>spring-cloud-sleuth-zipkin</artifactId>
<version>1.1.2.RELEASE</version>
</dependency>

属性文件:

1
2
3
4
5
spring.application.name=ServiceRegistryUsingConsulAndDistributedTrace
logging.level.org.springframework.web.servlet.DispatcherServlet=INFO
spring.zipkin.baseUrl=http://localhost:9411/
spring.sleuth.sampler.percentage=1.0
sample.zipkin.enabled=true

1
2
3
4
5
6
7
8
9
10
11
//Use this for debugging (or if there is no Zipkin server running on port 9411)
@Bean
@ConditionalOnProperty(value = "sample.zipkin.enabled", havingValue = "false")
public ZipkinSpanReporter spanCollector() {
return new ZipkinSpanReporter() {
@Override
public void report(zipkin.Span span) {
// log.info(String.format("Reporting span [%s]", span));
}
};
}